What is UX Testing?
Usability testing is the process of evaluating websites or apps with real users, which helps uncover issues that adversely affect User Experience. Usability is just one of many aspects that affect a user’s overall “user experience.” Usability testing takes many forms, from informal interviews and card-sorting exercises, to large, lab-based testing sessions.
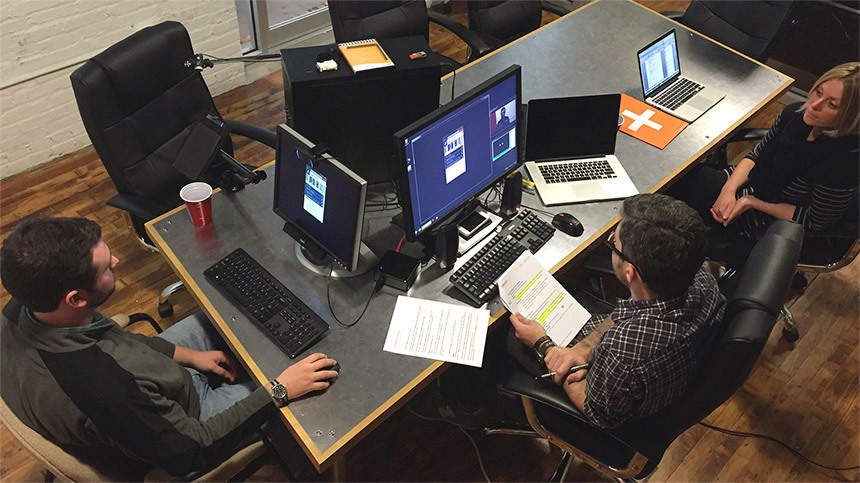
A usability testing session in progress.
Eye-Tracking Technology
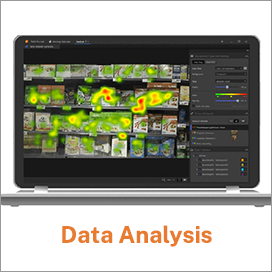
Using sophisticated eye-tracking systems, we collect detailed data on a user’s eye movements as they navigate your website, software, or app. The data is used to generate easy-to-understand visual reports.
We also record video of the user and all of their activities on the site. After each participant is tested, we conduct a “retrospective think-aloud” debriefing session to collect subjective feedback on their user experience.
Remote Testing
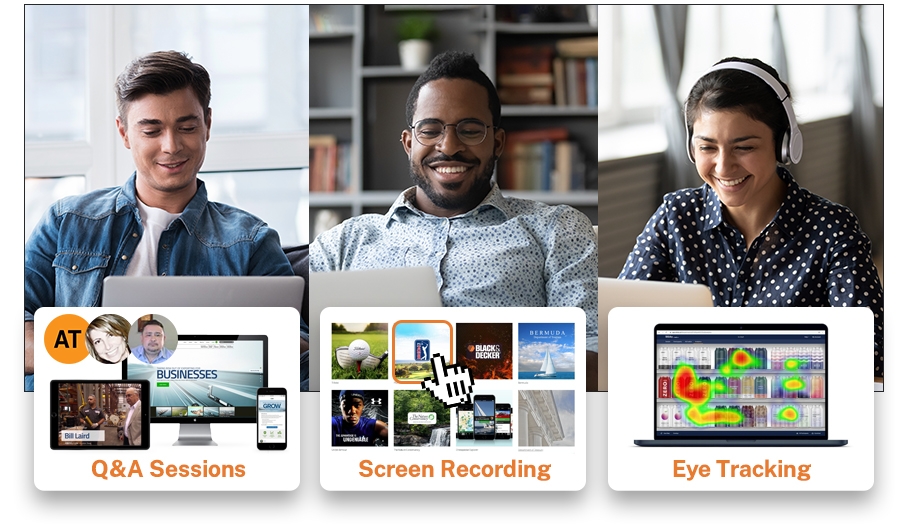
With remote usability testing you can gather feedback on your website, software, or app from real customers in the comfort of their own homes or offices. Our experts can conduct studies using any of the top video-conferencing and screen-sharing apps including Zoom, Join.me, and Microsoft Teams. For larger studies we leverage our Tobii Cloud platform to gather eye tracking data using off-the-shelf laptop webcams, which eliminates the need for in-person camera and hardware setup.
Frequently Asked Questions
Where does a usability study take place?
Usability studies (with or without eye-tracking) can take many forms, from small, informal think-aloud interviews, to professionally moderated sessions including one-way mirrors and multiple cameras. Virtual testing can also be performed remotely over the Internet. Participants can be recruited from specific locations, or pulled from a nationwide database.
How does eye-tracking work?
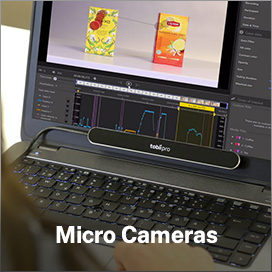
Eye movements are tracked using a specialized camera which records up to 60 data points per second. The data is then input into analysis software, which formats it and exports it into usable reports.
Is eye-tracking new?
No! In fact, the practice of monitoring others’ eye movements began over 100 years ago, but only in the past 50 years have we had technology advanced enough to record and visualize the data collected.
Beyond websites, what else can be eye-tracked?
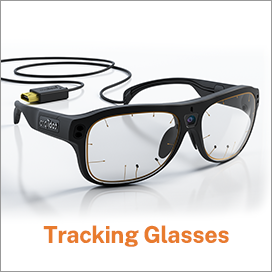
Almost anything you can see can be tested. While testing screen-based media (desktops, tablets, and smartphones) is common, the recent miniaturization of cameras allow eye-trackers to be placed into wearable glasses, enabling eye-tracking in real-world environments such as in the home, at the store, and even in a vehicle.
Why Test?
Identify Issues Before Launch
Testing a site early in the build process helps you avoid trouble later on. The planning, design, and development of a new site is expensive, but addressing user experience problems after it launches is even more costly.
Eliminate User Feedback Bias
While the test participants’ prompted verbal feedback is a valuable part of usability testing, eye-tracking, cursor-tracking, and screen recording lets you see deeper in the users’ actual experience. You can see exactly what they looked at at every moment. More importantly, you can see what they didn’t see. This helps eliminate “user bias,” where they attempt to explain what they saw or remembered about their experience.
Justify a Site Redesign
Usability testing helps expose a website’s weaknesses. Test it to find out how well it’s performing. Hard data is a better justification of the cost and effort to upgrade your site, rather than, “It just looks dated.” Lost sales or leads due to a negative user experience can quickly outpace the cost of proactively testing and improving the site.
See What They See
A variety of reports can be generated from eye-tracking data collected during a usability study, which illustrate to your team what users see (and do not see) while visiting your website. The examples below are from a test we conducted on myRA.gov, a website we built for the U.S. Treasury to promote their individual retirement account program.
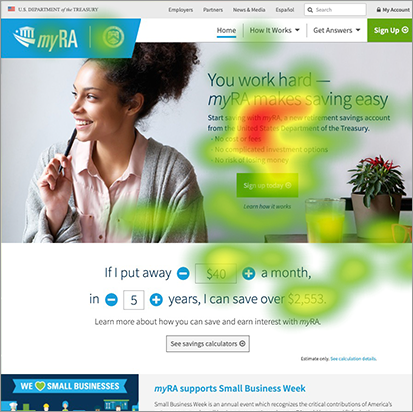
Heat Maps
Heat maps show the “hot spots,” or most-viewed areas of a page. Red indicates the greatest time of focus. Green, the least. Heat maps can display the data from one viewer or many.
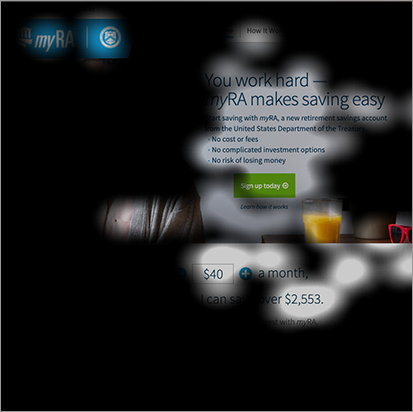
Shadow Maps
Like heat maps, shadow maps show areas of high and low focus. But instead of ‘temperatures’ of color, they use transparency to reveal what a user sees. Areas “in the shadows” received the least attention, or no attention at all.
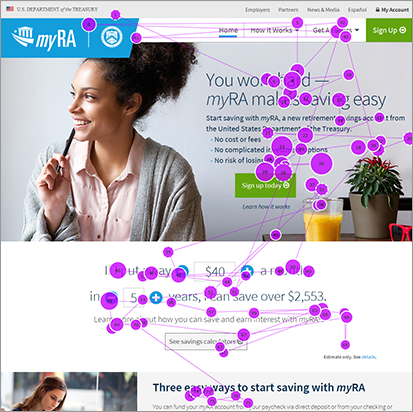
Gaze Plots
Gaze plots are diagrams of where a user looks, in what order, and for how long. Each dot represents a momentary “fixation” of the user’s eyes. The dots are sequentially numbered and vary in size. The larger the circle, the longer the user’s fixation on that area.
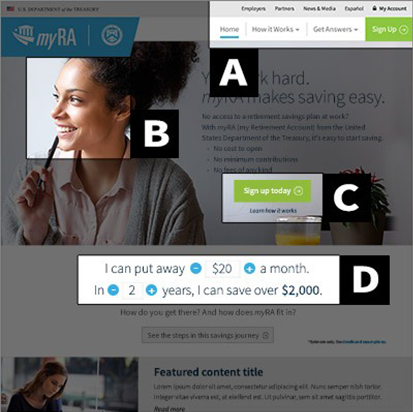
Areas of Interest
You can designate Areas of Interest (AOIs) for specific areas of a page such as menus, headlines, ads, and calls-to-action. AOIs allow us to quickly gather objective metrics on how long a user took to notice a certain item, or how long they fixated on a specific part of a page.
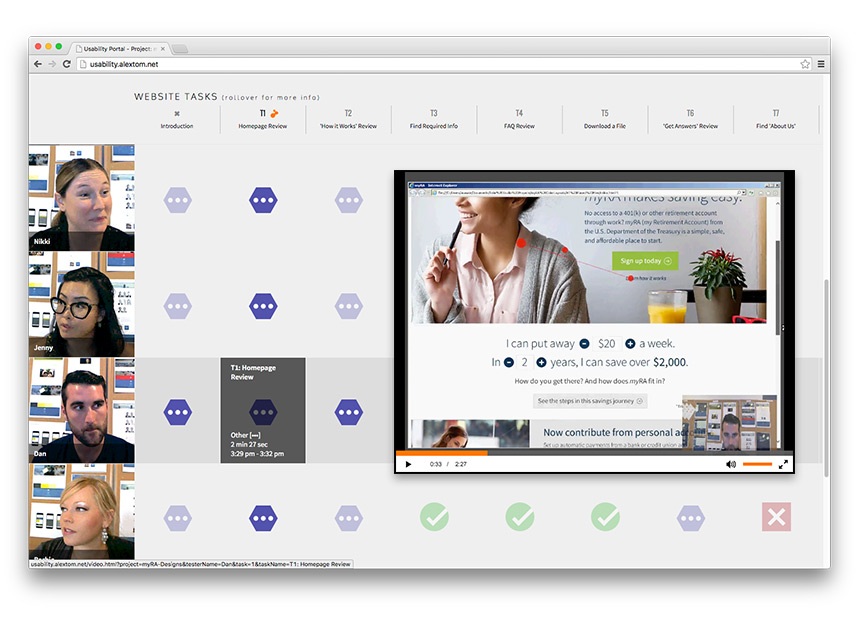
Results
Each client receives access to a personalized results portal, where you can log in to view test results. Material includes a summarized "key findings" report, video of each test participant, screen-capture playback, and visual reports.